Submit






TVS diode dynamic resistance is the local ratio between a change in clamping voltage and a change in avalanche current. It is not the DC resistance measured with a multimeter, and it is not constant across the full current range. A lower value generally means that clamping voltage rises more slowly as pulse current increases.
If a datasheet provides two VC and IPP points for the same part, pulse waveform, and temperature condition, the slope can be estimated as (VC2 - VC1) / (IPP2 - IPP1). The calculation becomes invalid when the two points come from different part numbers or different waveforms.
Why does voltage continue to rise after avalanche begins?
A TVS diode does not become an ideal short circuit in avalanche. The junction, metallization, bond wires, leads, and package contribute resistance and inductance. As pulse current rises, the voltage across the device normally rises as well. A fast current edge also produces inductive overshoot in the package and PCB.
For a small section of the clamping curve, engineers often use a first-order model consisting of an avalanche reference voltage plus current multiplied by dynamic resistance. This model is useful for comparing candidates near an expected operating point. It is not a substitute for the full curve or a board-level pulse test.
How should dynamic resistance be estimated?
Use the following sequence:
- Select two current points from the clamping curve of one part number.
- Confirm that both points use the same pulse shape, pulse width, and starting temperature.
- Record VC1, IPP1, VC2, and IPP2.
- Divide the change in voltage by the change in current.
- Label the result as an estimated slope for that current interval.
- Use the estimate near the selected interval and retain margin for tolerance, heating, and layout overshoot.
As a simple example, suppose one curve shows 38 V at 10 A and 42 V at 20 A. The estimated dynamic resistance between those points is 0.4 ohm. That result describes the 10 to 20 A region. Extrapolating it to several hundred amperes would ignore curve nonlinearity and thermal behavior.
Why are two different part numbers not two valid points?
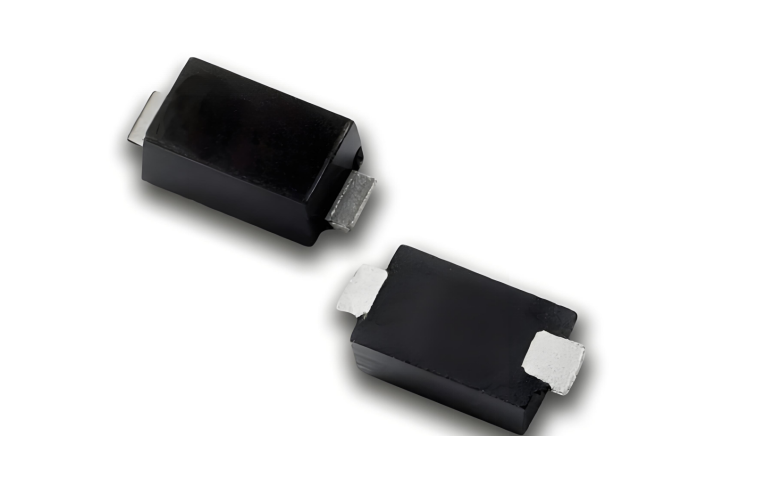
The ASIM SMA04J24V has a VRWM of 24 V, a VBR range of 26.7 to 29.5 V, and a maximum VC of 38.9 V at an IPP of 10.3 A. The SMB06J24V has the same voltage range and lists the same maximum VC of 38.9 V at 15.5 A.
It may be tempting to calculate (38.9 - 38.9) / (15.5 - 10.3) and report zero dynamic resistance. That conclusion would be wrong because the two points belong to different devices. Each package and die has its own curve.
The same caution applies to the SMC15J24V. It lists a maximum VC of 38.9 V at 38.6 A. This comparison shows that a larger power class can carry more specified current while remaining within the same maximum clamp-voltage limit. It does not provide a second curve point for any one model.
Cross-part comparisons can still establish several facts:
- whether VRWM and VBR are in the same voltage class;
- which IPP corresponds to the listed maximum VC;
- whether peak power is based on the same pulse waveform;
- whether package size and mounting suit the product;
- whether the downstream circuit has enough voltage margin.
An actual dynamic-resistance estimate requires two points from one part or a controlled pulse measurement on that part.
Is the lowest dynamic resistance always the best choice?
No. Lower dynamic resistance helps control VC at high current, but the device must remain off at the highest continuous voltage. It must also fit the required package, leakage-current budget, pulse energy, thermal environment, and cost target.
A practical selection process is:
- Reject voltage classes that can conduct during the worst normal operating condition.
- Estimate the current through the TVS from surge voltage, source impedance, and series elements.
- Read VC near that current from the maximum curve or table value.
- Check pulse duration, repetition rate, and temperature derating.
- Compare the protected-pin voltage with the downstream absolute maximum rating.
Dynamic resistance explains how the clamping point moves. It does not resolve the voltage window by itself.
How does the PCB alter the measured clamp voltage?
Datasheet VC is measured with a defined fixture and waveform. A product PCB adds trace inductance, via inductance, resistance, and a return path shared with other circuits. The protected IC can therefore see a voltage higher than the value measured directly across the TVS.
Useful measurement locations include:
- the connector or surge-injection point;
- the TVS terminals;
- the protected MOSFET, converter, or interface pin;
- the TVS return relative to the local system ground.
Use a short ground spring, coaxial connection, or suitable differential probe. A long probe ground lead can create ringing that looks like poor clamping. Record generator waveform, source impedance, polarity, cable configuration, operating state, and probe position.
How can an apparent dynamic resistance be measured on a bench?
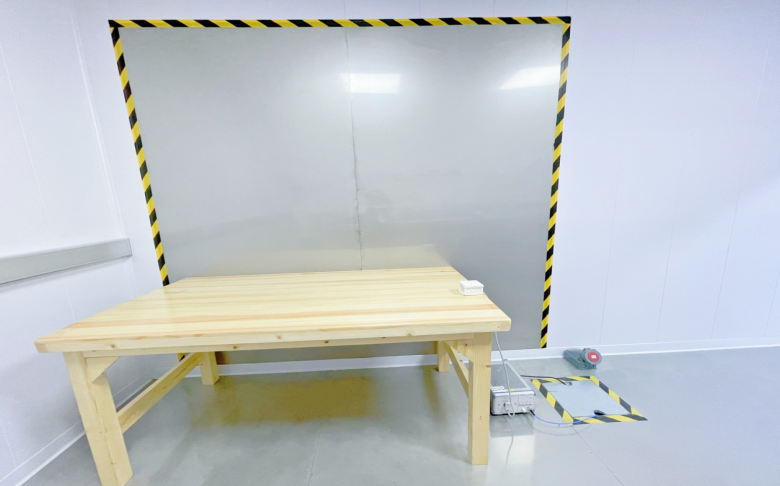
A transmission-line pulse system or other controlled pulse source can apply repeatable current levels while voltage and current are measured simultaneously. Keep pulse duration short enough to avoid unintended thermal drift, and allow the device to return to a known temperature between pulses.
Use multiple samples rather than one device. A useful report contains:
- part number, lot, and sample count;
- pulse waveform and repetition interval;
- measured current and voltage at each point;
- starting case or junction-temperature condition;
- fixture layout and probe bandwidth;
- leakage current before and after testing.
The measured slope includes the fixture unless the parasitics are characterized or de-embedded. It should therefore be called a system or fixture result when appropriate.
Common questions
Can VBR and VC be used as the two calculation points?
Only as a rough approximation. VBR and VC are usually measured at very different currents, and their test conditions may not match. Two points on one clamping curve are preferred.
Does lower dynamic resistance guarantee higher peak pulse power?
No. Peak pulse power also depends on die area, package, pulse width, starting temperature, and derating.
What if the datasheet provides only one VC and IPP pair?
That pair is useful for checking the maximum clamp at the stated current. It is insufficient for a reliable dynamic-resistance estimate. Request a curve or compare samples with a controlled pulse setup.
Does a higher measured VC mean the TVS is defective?
Not before current, waveform, temperature, probe loop, and PCB parasitics are checked. If the conditions match and the difference remains, investigate device lot and prior pulse damage.
Dynamic resistance is most useful when it remains attached to the current interval and test conditions from which it was derived. Removing those conditions turns a helpful slope into a misleading component label.
 Previous